Interactive graphs creating intuition
The advanced semiconductors physics course at the university covered ideas such as: band diagrams, absorption, generation, junction physics. For understanding these concepts, I built a set of interactive MATLAB GUI apps that let students drag a slider and watch a band diagram bend, or change a temperature and see the Fermi level shift.
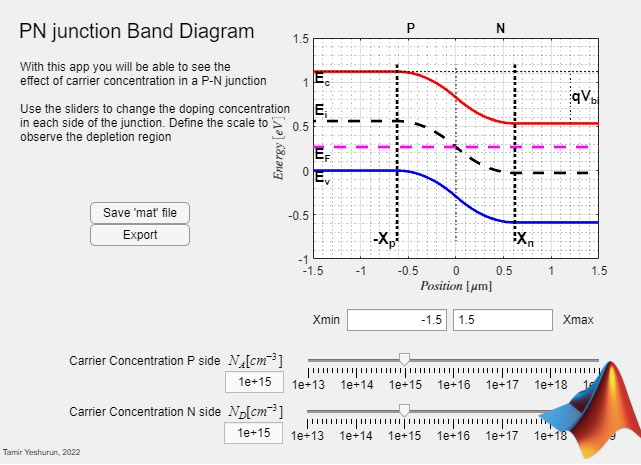
Band diagram of a PN junction.
Each app was scoped around one concept, and an intuitive set of controls, to create one clean visualization. The goal was to give students a faster path to the intuition behind it.
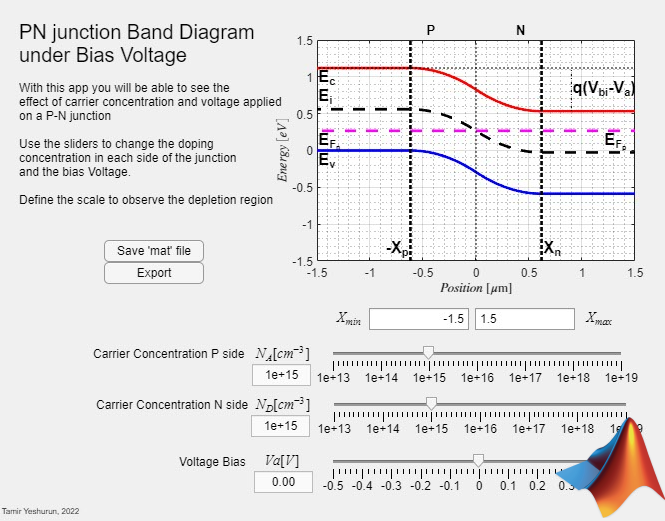
PN junction under bias — see the depletion region change in real time.
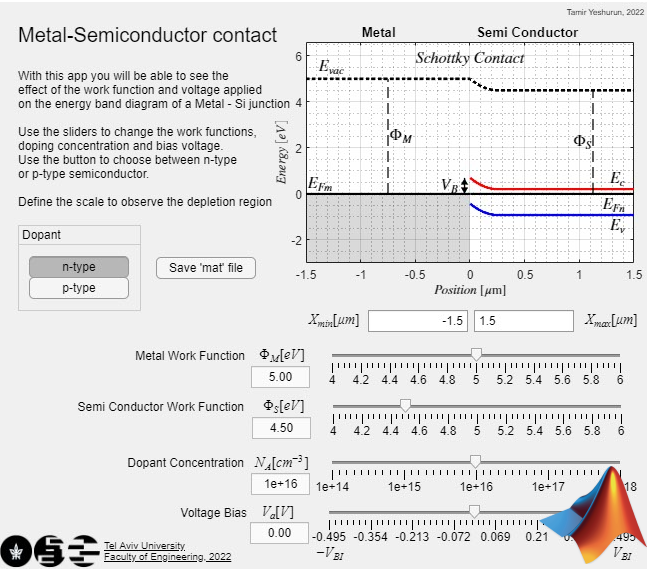
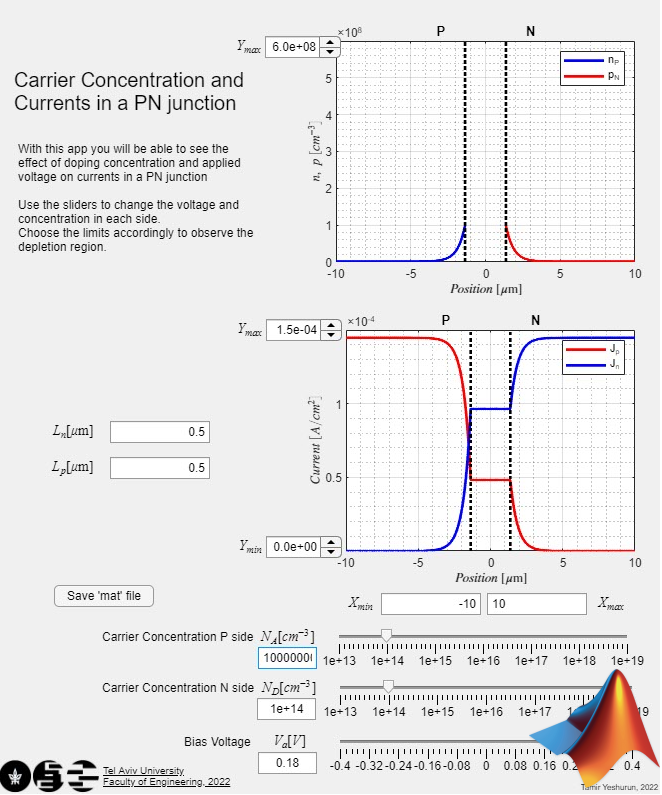
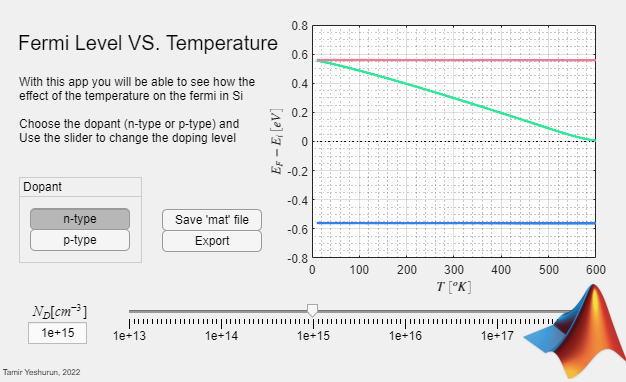
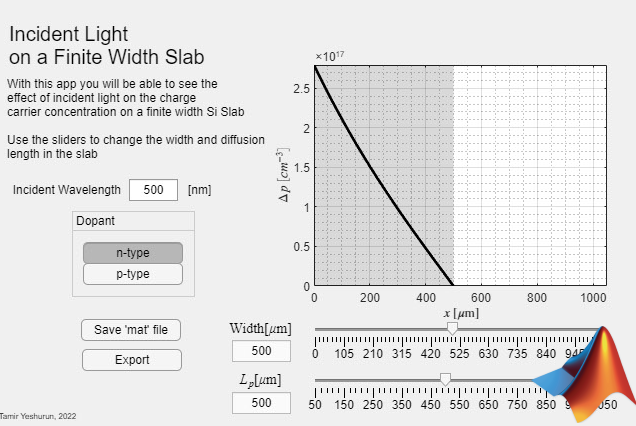
Check out the live web apps:
Open the live web apps